| StockFetcher Forums · Stock Picks and Trading · RIC | << >>Post Follow-up |
| Mactheriverrat 3,178 posts msg #122010 - Ignore Mactheriverrat modified |
11/18/2014 3:53:27 AM @ 2.86 for a breakout RIC Chart. |
| Mactheriverrat 3,178 posts msg #122014 - Ignore Mactheriverrat |
11/18/2014 3:28:09 PM Up on above average volume |
| stratiG 147 posts msg #122017 - Ignore stratiG |
11/18/2014 7:06:19 PM Nice, came on my 26W scan yesterday and nice follow through today. Nice call.. |
| adwalsh858 2 posts msg #122089 - Ignore adwalsh858 |
11/30/2014 11:59:19 PM stratiG Hello, I followed your posts on the Never Loose Again trading strategy and was wondering if you stayed with it. Thanks |
| Mactheriverrat 3,178 posts msg #122091 - Ignore Mactheriverrat modified |
12/1/2014 12:24:27 AM I look for stocks that have crossed above the EMA(13) and average day range(30) above 5.00 with Bollinger bands on the filter I was using. I think RIC was a Bollinger band breakout I posted this RIC 11/18/2014 3:53:27 AM and for there it went up some 12% to 12 % before losing steam. It too bad I wasn't using previous resistance lines It could have 22% gain before a pullback . I add draw high 4 week high to by filters after price crosses above the EMA(13) and touch or about to touch the 4 week high . I look at previous resistance lines. 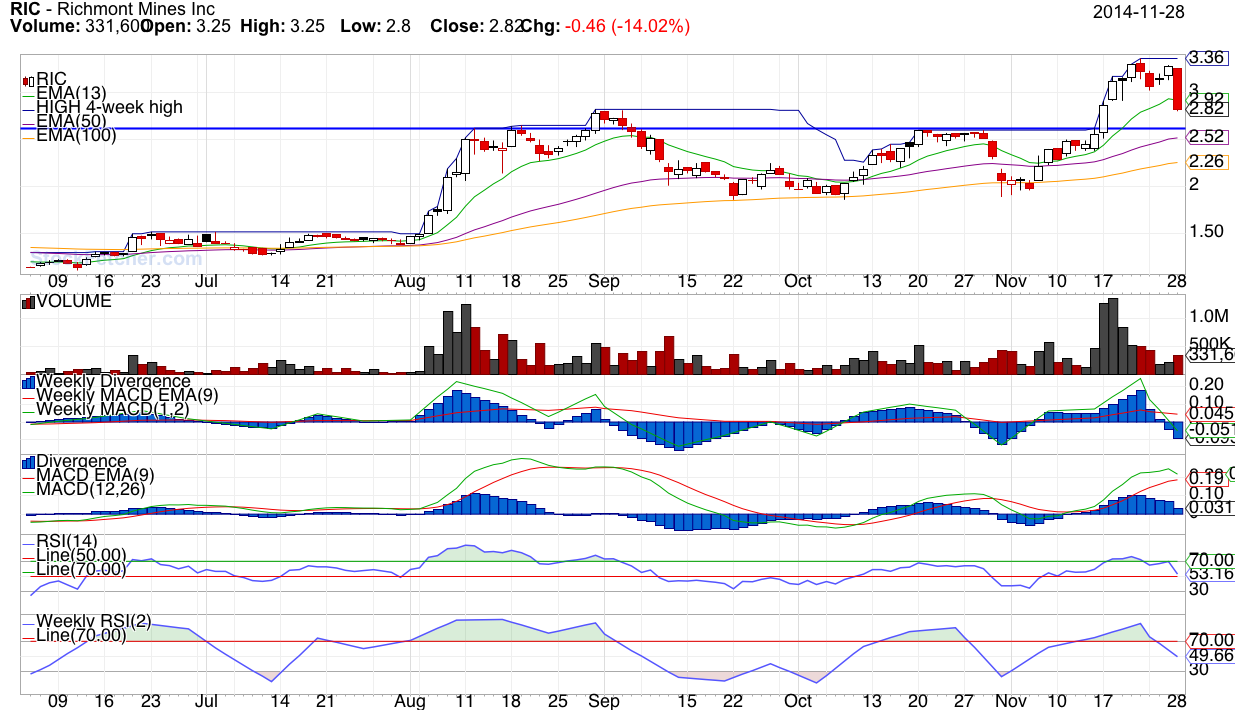 |
| StockFetcher Forums · Stock Picks and Trading · RIC | << >>Post Follow-up |